Article Summary – Paint Tumor


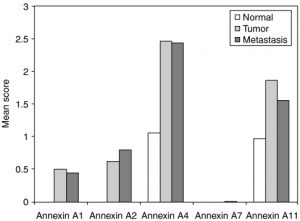
(Normal, colorectal tumor, and metastasizing colorectal cancer cells analyzed for intensity of annexin protein staining.)

1)The TITLE you would give these figures. Make it a single declarative statement about the data.
The cancer cells have higher annexin protein than the normal cells.

2) The background that the authors must have had in mind that made them ask this question. To do this, use the review article you read for last class.
MMPs break down ECM which pave the way for tumor cells to rapidly grow and enhancing the blood vessels (good environment for tumor growth) which also help the growth of tumor cells. Annexin helps to regulate MMPs, and therefore controls tumor growth.

3) The question asked. What were the researchers trying to figure out that led them to gather these data?
Which type of annexin(annexin A1, annexin A2, annexin A4, annexin A7, or annexin A11) have stronger protein staining on tumor and metastasis cells?

4) The methods employed. What were the subjects, the manipulations, the controls, the data collected?
Subjects: dead patients
Manipulations:
Independent variable: human cell
Dependent variable: intensity (color)
Control: normal human cells
Data collected: intensity of annexin protein staining in different type of cells (normal, colorectal tumor, and metastasizing colorectal cancer cells).
They extracted cells from dead bodies, applied stains on the cells, and observed the intensity stain of different types of cells (normal, colorectal tumor, and metastasizing colorectal cancer cells) under a microscope, to observe the intensity of annexin protein staining.

5) The observations made. What did they SEE
The highest and second highest percentage of the intensity of protein staining across the three cells are in Annexin A4 and A11 respectively. Within each Annexin A1, A4, and A11, tumor cells have the highest percentage of intensity staining. The percentage of intensity staining of normal cells in Annexin A4 and Annexin A11 are slightly similar. In Annexin A7, there is no visible intensity of protein staining in normal and collateral cells and barely any in metastasis cells.

6) The conclusions reached. Don’t OVER-reach – but how can one interpret these observations to address the question you imagine the researchers asked?
According to the graph, we can infer that there is more of Annexin A4 compared to the other types of Annexin in normal, colorectal tumor, and metastasizing colorectal cancer cells. There tends to be more Annexin in tumor and metastasizing colorectal cancer cells than normal cells, but this may not be the case in Annexin A7.


Khmer Poem Book Publication

Poems and rhythms are big parts of the Khmer culture. Khmer poets have been composing different types of poems for centuries. To preserve and spread this culture, our Khmer class decided to write, design and publish our own poetry book. We composed a massive collection of poems about everything which includes food, parents, love, ambition, and more. In addition, we have steps to formulate varieties of both ancient and modern Khmer style poetry and the history behind them. We put everything into book format and printed 30 copies for the Khmer Literature Festival.

PS: We sold all 30.


Quantized Energy Levels

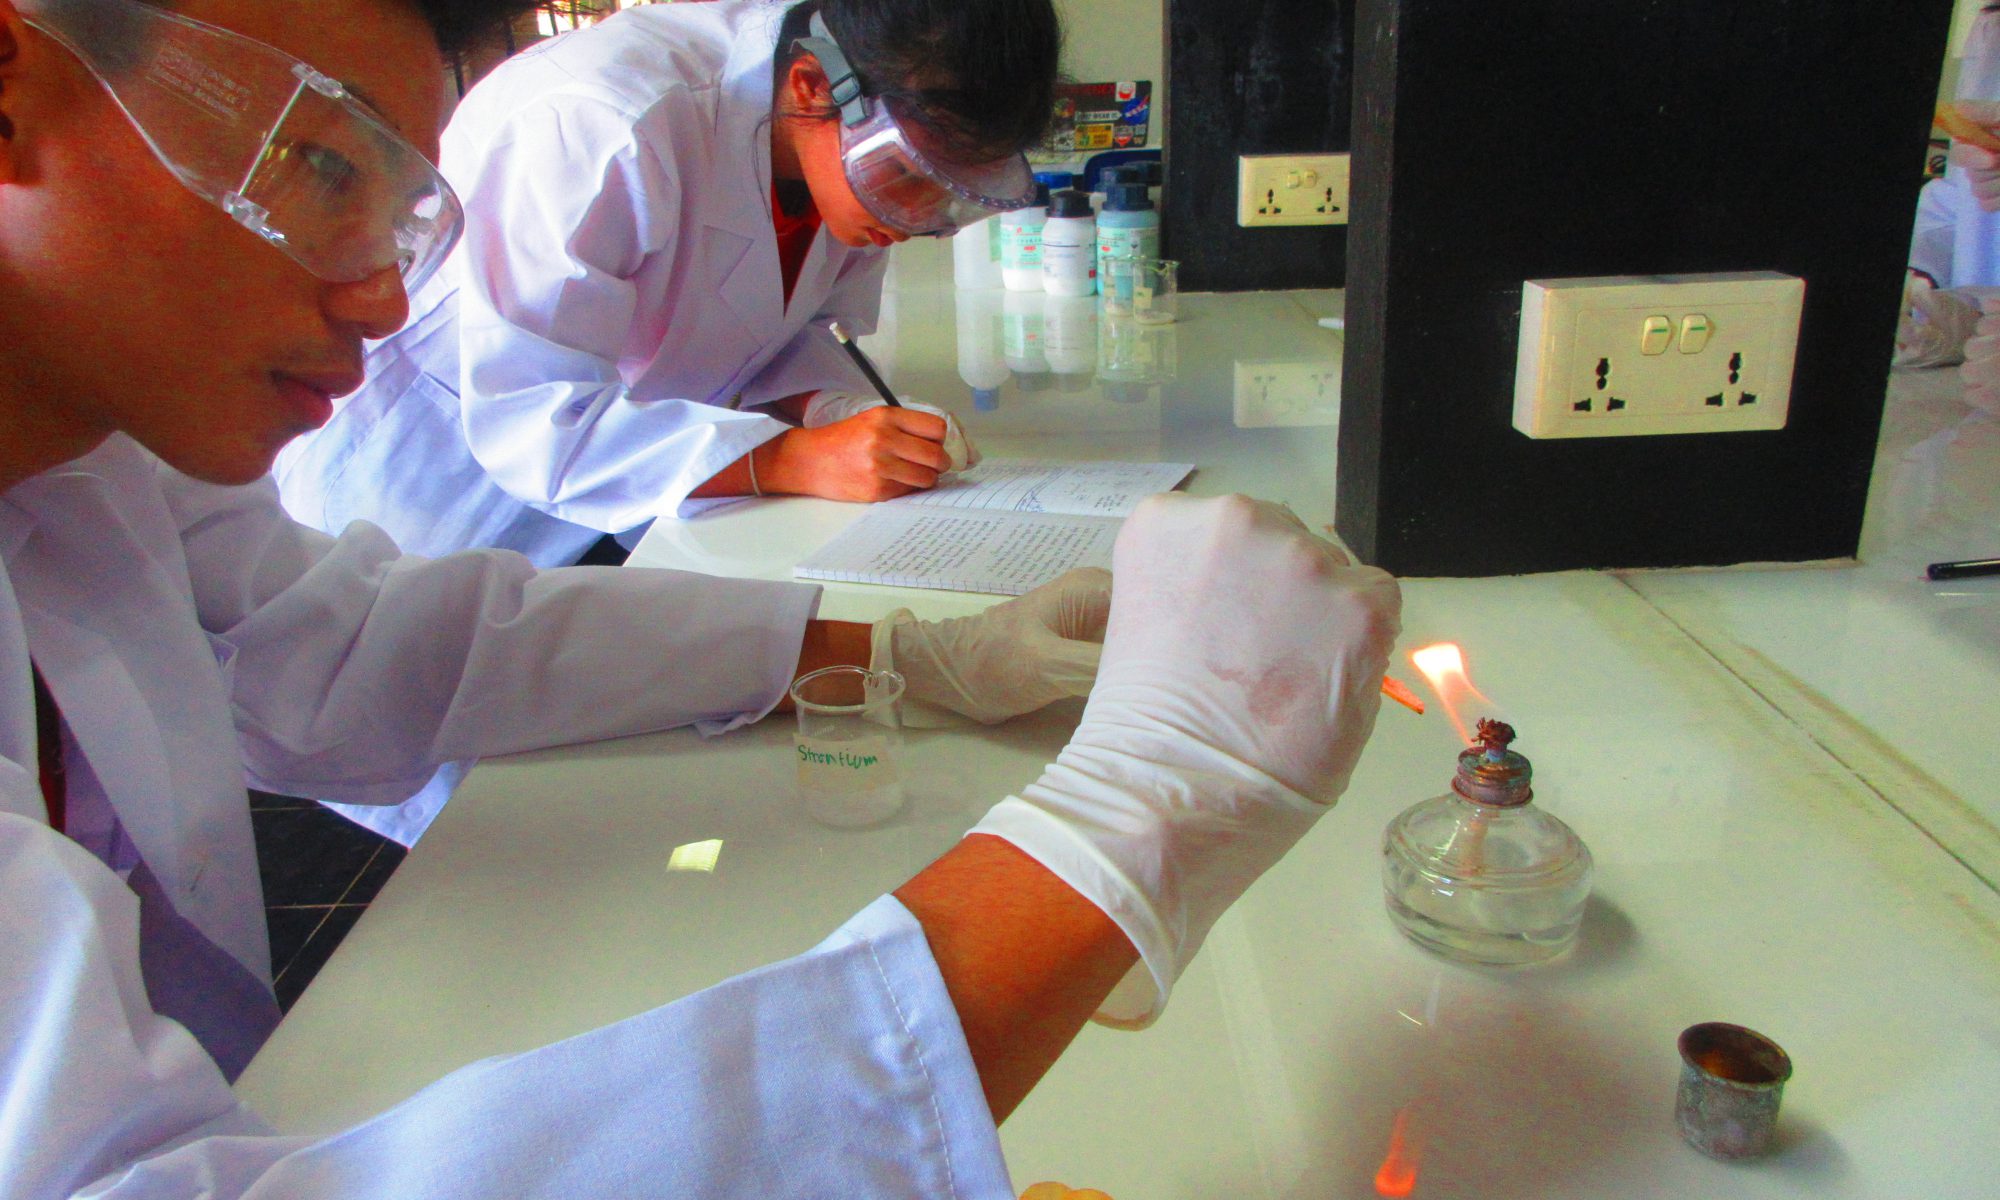
Below is a lab report for an experiment I did in my Chemistry Class to understand what quantized energy level is.

Procedure:

  1. Light the Bunsen burner (turn the gas on so you can just hear it, then use the striker)
  2. Place the wood splint for each compound into the flame using tongs or tweezers- ONE AT A TIME!
  3. Take note of the color of the flame and return the wood splint to the solution.
  4. CLEAN UP YOUR STATION! Carefully put the stoppers back on the solutions! Make sure the station looks like it did when you started! Let me know if you need new splints!
  5. Wash your hands thoroughly before leaving the laboratory


Pre-lab questions

  1. We see colors in the flame tests because different color means different energy emitted.
  2. We will test the substance qualitatively by burning the salt and judge the color with our eyes. We can then use the wavelength corresponding to the color to quantify the data.


Data Table: make a section of your lab labeled Data Table and make a data table similar to the one below to record your observations.

Compound Color of Flame (qualitative) Wavelengths of light (in Å) (quantitative)
Barium Chloride Yellow 570-590nm
Calcium Chloride Light Red 620-750nm
Copper (II) Chloride Green 495-570nm
Lithium Chloride Red 620-750nm
Potassium Chloride Orange 590-620nm
Strontium Chloride Red 620-750nm
Unknown #1    


Discussion and Analysis: (In a section labeled Discussion and Analysis answer the following questions in complete sentences)
How do your results from the flame test provide support for quantized energy levels? Explain your answer.
When exposed to flame, electrons move from one orbital to another, which then cause the photon emitted to have different energy levels, or in other words, different wavelengths. And colors result from light traveling at different wavelengths. By looking up the wavelength corresponding to each color, we can write our data in a quantifiable manner.


Conclusion: (answer in a complete paragraph and in complete sentences) What are two possible sources of error for this lab. How would the errors affect your lab? What would you do differently next time to counteract these errors?
One possible source of error can be my judgment of the color of the flame. This can significantly affect the result of the lab because it’s the basis of how I got the wavelengths of light. Next time, I can just take pictures, measure the color codes and find the wavelengths in a more accurate manner. Another source of error can be the time at which I record the data. The color of the salt changed as I let it burn. If I recorded data at different times, the color will change and the data won’t be accurate. Next time I will record the data after 3 seconds for all types of salt.

American History

This round of literacy focused on the study of the American history as it was beneficial since we are sitting the SAT. We read and discussed major events such as the American Civil War, the Great Depression, and the American revolution. We also studied the meat packing industry, immigration, and Native Americans. Below is my analysis of the causes of the American Civil War.

The Civil War resulted from the different views of the South and the North on slavery: slavery was part of the Southern way of life – as agriculture in the Southern climate benefited from having slaves – whereas the North viewed slavery as something against their moral belief. According to the article, the Southerner could worth zero cent and end up being worth “100,000 to a million of dollars” in just five years because of the “free labor” they were exploiting. On the other hand, the Northerner(who were about “20 percent” “foreign-born”), who had “no need for slaves,” no concern for Southern “lifestyle or traditions,” and with a religion that “prohibited slavery,” wanted slavery gone. The Northerners even went as far as to “rescue fugitive blacks from the slave catchers.” This shows that the conflict – the Civil War – arose because the Southerners, whose population were half slaves, thrived under slavery and wanted it to continue while the Northerners, who didn’t benefit much from owning slaves and had a moral obligation against the practice, wanted slavery gone.

Circle Equation

The standard circle equation is  (x – h)2 + (y – k)2 = r2, with the coordinate of the center being (h,k) and the radius being r. 

A problem might be, 

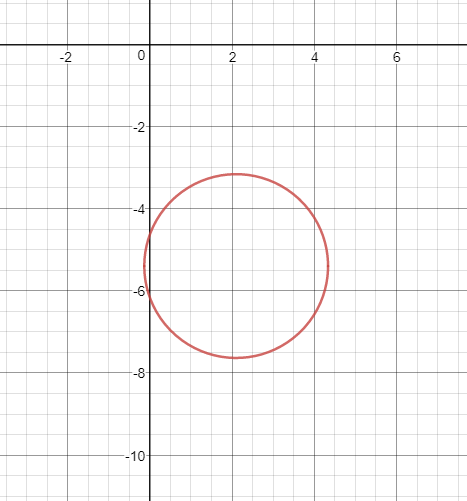
A circle has a radius of √5 units and is centered at (2.1,-5.4). What’s the equation of the circle?

We can solve this using the circle equation. 

(x – h)2 + (y – k)2 = r2, and h is the x-coordinate of the center which is 2.1, k is the y-coordinate of the center which is -5.4, and r is the radius of the circle which is √5. We can rewrite the equation as (x – 2.1)2 + (y – (-5.4))2 = √52, or (x – 2.1)2 + (y + 5.4)2 = 5.